[原創] How to draw in JavaScript? Back
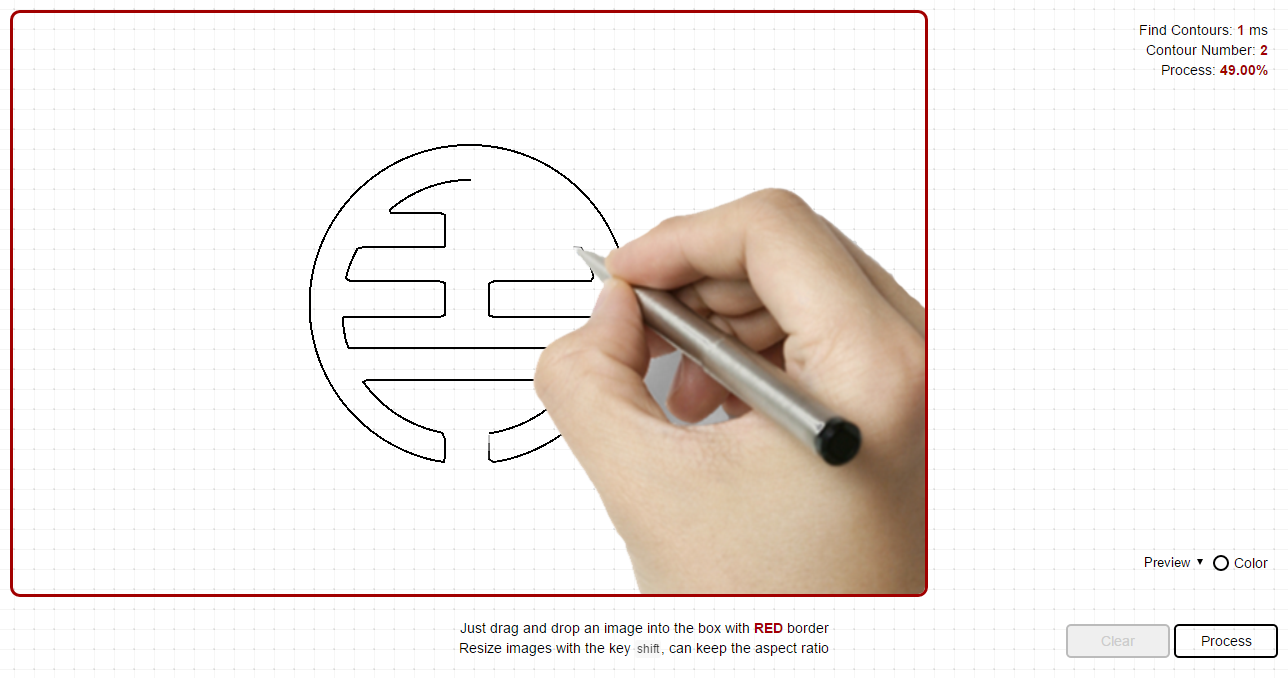
Figure 1.1 A simple preview
Since my company has given me a requirement of drawing in a browser programmatically, simply shown as Figure 1.1 above, I would like to share some points with you about drawing in JavaScript. Actually, what we're going to draw? Any kind of images and graphics.
Here is a demo for you, or you can directly click into http://draw.soundtooth.cn/. What you should is to drag any pictures and drop into the box with a red border, and then just click 'Process' button to start the process of drawing:
Note that this is a project which belongs to my company, and that's why I'm not going to open the source code in the public community.
At the beginning of the project, I was exactly inspired by the animation of drawing a glowing line in this article. If you read it in details, you'll also find that before we draw any graphics, what we need is the data of paths, with which we can simulate the drawing. The format of those data should be like this:
M 161.70443,272.07413
C 148.01517,240.84549 134.3259,209.61686 120.63664,178.38822
C 132.07442,172.84968 139.59482,171.3636 151.84309,171.76866
You may doubt that such data is only legal in an SVG element, named path, and how can we draw all kinds of pictures like JPG, PNG, or GIF. That's another topic going to be discussed later in this post. Before that, we can just simply draw an SVG file.
1. Drawing an SVG file
What is SVG? Scalable Vector Graphics a.k.a SVG is an XML-based vector image format for two-dimensional graphics with support for interactivity and animation. In older IE browsers, such kind of files is not supported at all. If you're a designer or an illustrator who usually used Adobe Illustration as one of your drawing tools, you may be already similar to those kinds of graphics. What the main difference is, an SVG is scalable and lossless opposed to other formats of pictures.
Note that, generally pictures with SVG formats are called as graphics, while those with any other formats are called as images.
1.1 Extracting data from an SVG file
As mentioned above, before drawing an SVG file, what you need to do is to read data from an SVG file. It's the duty of an object, named FileReader in JavaScript, of which the initialization code snippet should look like this:
if (FileReader) {
    /** if the browser support FileReader Objects */
    var fileReader = new FileReader();
}
As a Web API, FileReader has given you a chance to read local files, in which readAsText is one of the methods supported for reading contents with text format. As it may trigger the onload event set before being called, we can exactly read the content inside an event handler. So, the code of reading contents should be:
fileReader.onload = function (e) {
    /** contents of an SVG file */
    var contents = e.target.result;
};

fileReader.readAsText(file);
With reading listener, you may consider whether we're going to upload a file with a button? Oh, that may be just a normal and unattractive way for interactions. Besides this, we can improve this way with dragging and dropping. It means that you can drag any graphics you want and drop it into the box for reading contents. Since Canvas is the first technical choice of my project, I would like to implement this way by setting up an event listener and registered for the drop event of a canvas.
/** Drop Event Handler */
canvas.addEventListener('drop', function (e) {
    /** e is where we can extract out the `file` objecj */
    var file = e.dataTransfer.files[0];

    /** start to read file contents */
    fileReader.readAsText(file);
});
1.2 Processing data
Now we know the data is already stored in the variable contents, and how can we process it, which is the only text for us. In the beginning, I have tried to use regular expressions to extract path nodes:
var paths = contents.match(/<path([\s\S]+?)\/>/g);
But in this way, it may result in two drawbacks:
- Lose the whole structure of the SVG file.
- Unable to create a legal DOM element,
SVGPathElement.
To explain it more explicitly, you can check the code as followed:
if (paths) {
    var pathNodes = [];
    var pathLen = paths.lenght;

    for (var i = 0; i < pathLen; i++) {
        /** create a legal DOM node, SVGPathElement */
        var pathNode = document.createElementNS('http://www.w3.org/2000/svg', 'path');

        /** use a temporary div elements for reading the attribute `d` */
        var tmpDiv = document.createElement('div');
        tmpDiv.innerHTML = path[i];

        /** set it into the legal one */
        pathNode.setAttribute('d', tmpDiv.childNodes[0]
            .getAttribute('d')
            .trim()
            .split('\n').join('')
            .split('    ').join('')
        );

        /** store it into an array */
        pathNodes.push(pathNode);
    }
}
As you see, tmpDiv.childNodes[0] is not an SVGPathElement, so we need to create another node. What if I use another way to read the whole SVG file, and you can see that the variable SVGPath has stored the whole SVG objects with a clear structure, and it's also available to be accessed wherever you want:
var tempDiv = document.createElement('div');
tempDiv.innerHTML = contents.trim()
    .split('\n').join('')
    .split('   ').join('');

var SVGNode = tempDiv.childNodes[0];
With a recursive way, we can easily extract all SVGPathElements and directly push them into the array pathNodes:
var pathNodes = [];

function recursivelyExtract(parentNode) {
    var children = parentNode.childNodes;
    var childLen = children.length;

    /** If the node has no children, then directly return */
    if (childLen === 0) {
        return;
    }

    /** Loop to extract nodes when it's an SVGPathElement */
    for (var i = 0; i < childLen; i++) {
        if (children[i].nodeName === 'path') {
            pathNodes.push(children[i]);
        }
    }
};

recursivelyExtract(SVGNode);
It does seem so elegant to use that way, and at least it does for me, especially in the case with other elements to draw, I can just use a switch structure to extract different elements, rather than using several regular expressions. Generally, in an SVG file, also can shape be defined as circle, rect, polyline, or line, not only as path. Therefore, how can we handle them? Just to convert them all into path elements with JavaScript, mentioned later.
There was one problem as I developed the project, which should be paid more attention to. In data of paths, m and M is completely not the same, and in a compound path, there should be more than one m or M, so you have to split them out, to avoid drawing lines between two paths. It means that you have to distinguish these two notations after you confirm the path belongs to compound paths:
function generatePathNode(d) {
   var path = document.createElementNS('http://www.w3.org/2000/svg', 'path');
   path.setAttribute('d', d);
   return path;
};

var d = children[i].getAttribute('d');

/** to solve the problem of compound paths */
var ds = d.match(/m[\s\S]+?(?=(?:m|$)+)/ig);
var dsLen = ds.length;

/** compound paths */
if (dsLen > 1) {
    /**
     * distinguish m and M
     * ...
     */
} else {
    pathNodes.push(children[i]);
}
1.3 Drawing in Canvas
Now that paths have been extracted and stored in a local variable, the next step we should do is to draw them with points:
var pointsArr = [];
var pathLen = pathNodes.length;

for (var j = 0; j < pathLen; j++) {
    var index = pointsArr[].push([]);
    var pointsLen = pathNodes[j].getTotalLength();

    for (var k = 0; k < pointsLen; k++) {
        /** extract points from a path */
        pointsArr[index].push(pathNodes[j].getPointAtLength(k));
    }
}
As you can see, pointsArr is a two-dimensional array, with paths in the first dimension, and points of each path in the second one. Certainly, those points is exactly what we can used to draw in Canvas like this:
/** draw the path with a given index */
function drawPath(index) {
    var ctx = canvas.getContext('2d');
    ctx.beginPath();

    /** set path */
    ctx.moveTo(pointsArr[index][0].x, pointsArr[index][0].y);

    for (var i = 1; i < pointsArr[index].length; i++) {
        ctx.lineTo(pointsArr[index][i].x, pointsArr[index][i].y);
    }

    /** render */
    ctx.stroke();
}
Try to think about a problem: what if a path includes so many points to draw, how can we optimize it to draw fast? Perhaps, jumping to draw is a simple way to solve the problem, but how to jump is, however, another critical problem for you and me. Though I haven't found the perfect solution, I'm glad that you can give out any ideas.
function optimizeJump() {
    var perfectJump = 1;

    /**
     * an algorithm to calculate the perfect jump value
     * ...
     */
    return perfectJump;
}

function drawPath(index) {
    var ctx = canvas.getContext('2d');
    ctx.beginPath();

    ctx.moveTo(pointsArr[index][0].x, pointsArr[index][0].y);

    /** optimization with jumping to draw */
    var perfectJump = optimizeJump();
    for (var i = 1; i < pointsArr[index].length; i+= perfectJump) {
        ctx.lineTo(pointsArr[index][i].x, pointsArr[index][i].y);
    }

    ctx.stroke();
}
The algorithm is exactly the place we should think more about.
1.4 Calibration parameters
As the requirement gets more and more complicated, we may find that data of paths cannot fit the case at all, when we want to scale and resize or move graphics in Canvas.
1.4.1 Why we need calibration parameters?
Since you would like to scale and resize, or even move graphics in Canvas, it means that the data of paths should be changed corresponding to your actions. Unfortunately, it won't, and that's exactly why we need calibration parameters.
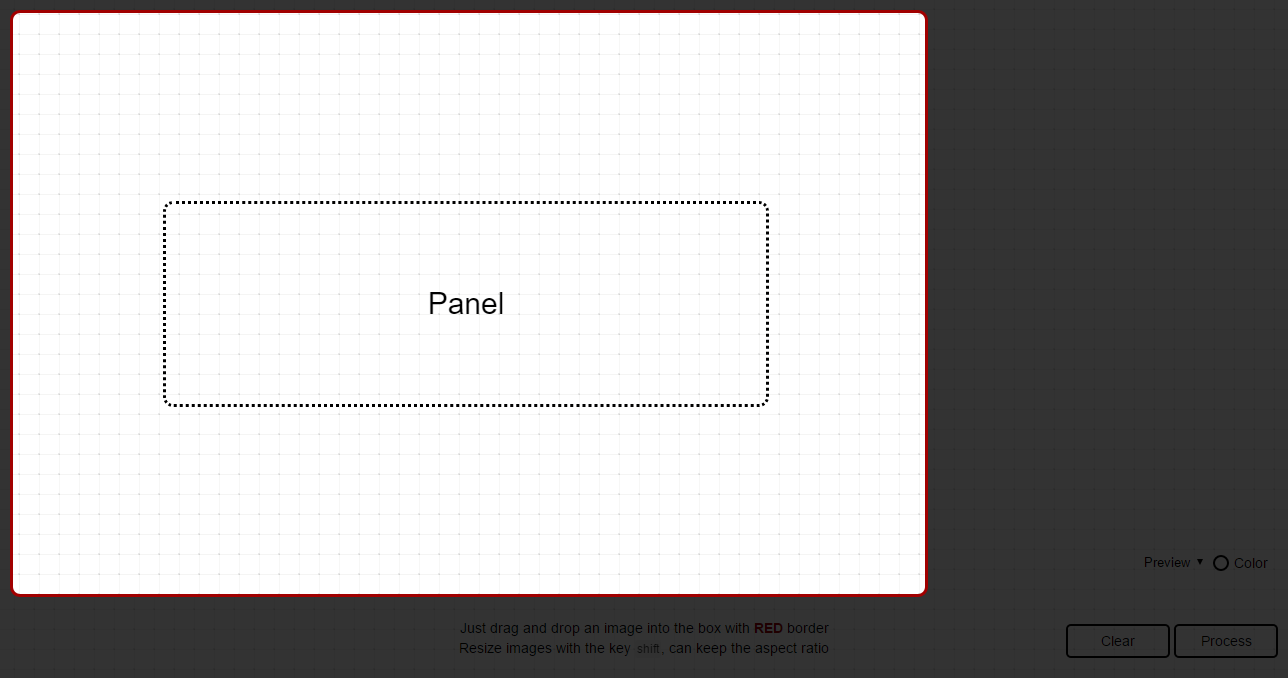
Figure 2.1 A so-called panel
Figure 2.1 has shown you a highlight work area, which is called a panel by me, and it is that panel in which you can drop, drag and resize, or move graphics. In fact, it has included a Canvas object inside, which is implemented to satisfy your requirements. Supposed we have an SVG file (Figure 2.2) to draw, we can just drop it into the panel box, and rendered on the screen like Figure 2.3:

Figure 2.2 An SVG file to draw
Such a wonderful logo, full of Chinese styles.
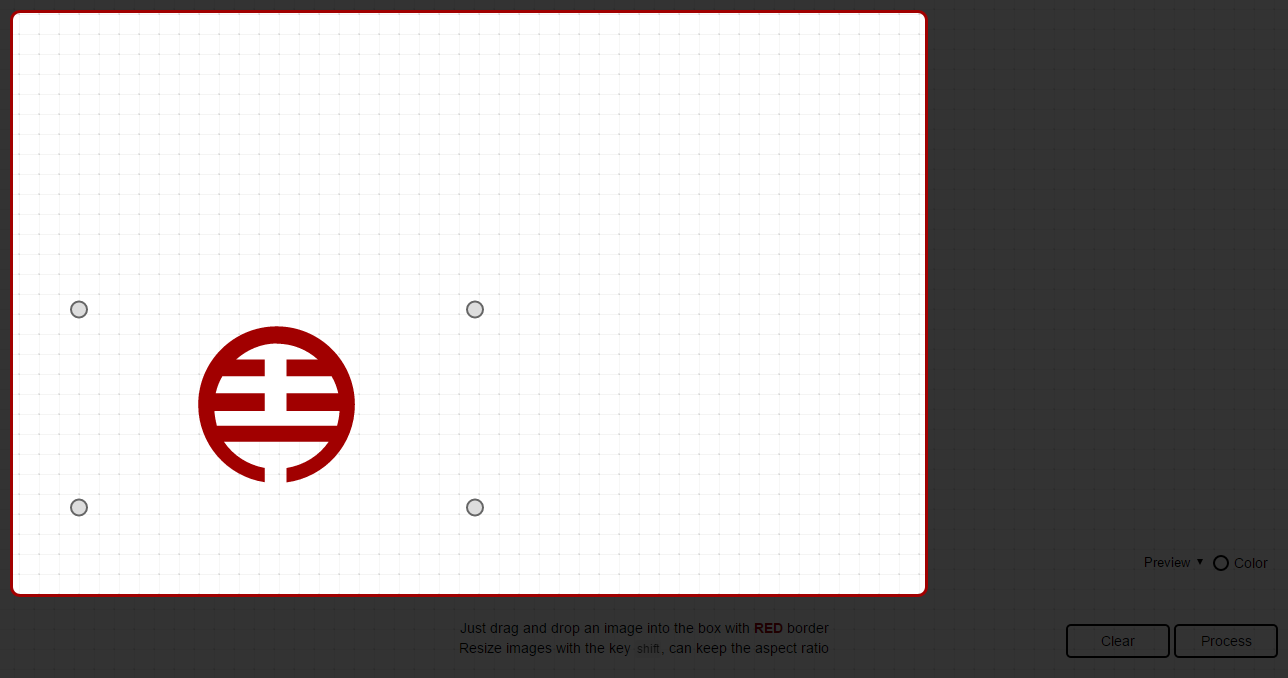
Figure 2.3 Rendered graphics
Except your operating on the graphic, some attributes of the SVG file will also affect data of paths, like width, height, and viewBox.
<svg xmlns="http://www.w3.org/2000/svg" width="400" height="200" viewBox="0 0 200 200">
    <!-- paths -->
</svg>
Therefore, the calculation of calibration parameters will have two factors: corresponding to attributes and actions.
1.4.2 Calculation
Before calculating, we're going to know about some defined variables, and what they actually represent for.
Firstly, when it comes to the position of graphics:
- oriX: the original
xvalue of the graphic - oriY: the original
yvalue of the graphic - moveX: the difference of the
xvalue after moving. - moveY: the difference of the
yvalue after moving. - viewBoxX: the
xvalue of the attributeviewBoxin that graphic - viewBoxY: the
yvalue of the attributeviewBoxin that graphic
And then, the size of the graphics:
- oriW: the original width of the graphic
- oriH: the original height of the graphic
- svgW: the width of the SVG element
- svgH: the height of the SVG element
- viewBoxW: the width of the attribute
viewBoxin that SVG element - viewBoxH: the height of the attribute
viewBoxin that SVG element - curW: the current width of the graphic
- curH: the current height of the graphic
Now we know what all these parameters mean, and then we can start to calculate the calibration parameters.
To calculate the current position of graphics, we can use an expression like this:
var x = oriX + moveX;   /** current x value of the graphic */
var y = oriY + moveY;   /** current y value of the graphic */
And to calculate the difference of ratios, here is another expression:
var ratioParam = Math.max(oriW / svgW, oriH / svgH) * Math.min(svgW / viewBoxW, svgH / viewBoxH);

var ratioX = (curW / oriW) * ratioParam;
var ratioY = (curH / oriH) * ratioParam;
What we should remember is that the x and y value of the attribute viewBox will also affect graphics with cropping (as shown in Figure 2.4). Therefore, we need to filter them out of the original points.
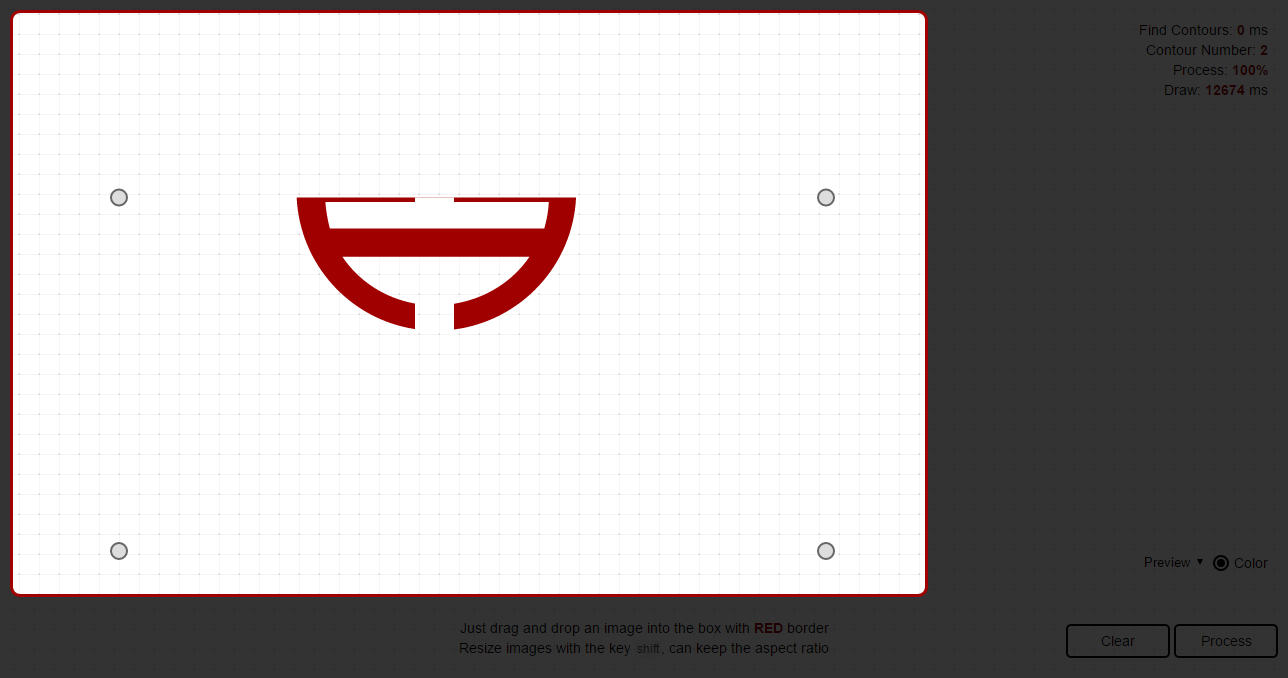
Figure 2.4 Cropped graphics
For me, I have just rewrite them with a maximum or a minimum for the edge point. For example, if the position of points is out of the graphic, I will rewrite them by changing x or y, or even both when necessary, to the edge of graphics.
point.x = point.x >= x && point.x <= x + curW ? point.x : ((point.x < x) ? x : x + curW);
point.y = point.y >= y && point.y <= x + curH ? point.y : ((point.y < y) ? y : y + curH);
As far as I'm concerned, it's recommended to remove them rather than to rewrite them when the number of points is large.
1.5 Convert all shapes into path elements
At this moment, we have already known how to draw path elements in JavaScript, but as mentioned above, some shapes are defined with other elements like rect, polyline, circle, and so on. To draw them all, we should convert them into paths before. In this chapter, I will introduce how to do this.
1.5.1 Circles & Ellipses
circle and ellipse elements are similar to each other with both attributes shown in Table 2.1:
| Circles | Ellipses |
|---|---|
| CX | CX |
| CY | CY |
Table 2.1 Attributes both they have
And Table 2.2 has shown the differences between them:
| Circles | Ellipses |
|---|---|
| R | RX |
| RY |
Table 2.2 Different attributes between them
Then we can convert them like this:
function convertCE(cx, cy) {
    function calcOuput(cx, cy, rx, ry) {
        if (cx < 0 || cy < 0 || rx <= 0 || ry <= 0) {
            return '';
        }

        var output = 'M' + (cx - rx).toString() + ',' + cy.toString();
        output += 'a' + rx.toString() + ',' + ry.toString() + ' 0 1,0 ' + (2 * rx).toString() + ',0';
      output += 'a' + rx.toString() + ',' + ry.toString() + ' 0 1,0'  + (-2 * rx).toString() + ',0';

      return output;
    }

    switch (arguments.length) {
    case 3:
        return calcOuput(parseFloat(cx, 10), parseFloat(cy, 10), parseFloat(arguments[2], 10), parseFloat(arguments[2], 10));
    case 4:
        return calcOuput(parseFloat(cx, 10), parseFloat(cy, 10), parseFloat(arguments[2], 10), parseFloat(arguments[3], 10));
        break;
    default:
        return '';
    }
}
1.5.2 Polylines & Polycircles
For these both elements, what you should do is to extract out the attribute points. and recompose them into a special format for d value of path elements.
/** pass the value of the attribute `points` into this function */
function convertPoly(points, types) {
    types = types || 'polyline';

    var pointsArr = points
        /** clear redundant characters */
        .split('   ').join('')
        .trim()
        .split(/\s+|,/);
    var x0 = pointsArr.shift();
    var y0 = pointsArr.shift();

    var output = 'M' + x0 + ',' + y0 + 'L' + pointsArr.join(' ');

    return types === 'polygon' ? output + 'z' : output;
}
1.5.3 Lines
Generally, line elements will have some attributes defined for positioning the start point and the endpoint of a line: x1, y1, x2, and y2.
Easily can we calculate like this:
function convertLine(x1, y1, x2, y2) {
    if (parseFloat(x1, 10) < 0 || parseFloat(y1, 10) < 0 || parseFloat(x2, 10) < 0 || parseFloat(y2, 10) < 0) {
        return '';
    }

    return 'M' + x1 + ',' + y1 + 'L' + x2 + ',' + y2;
}
1.5.4 Rectangles
Rectangles will also have some attributes defined for positioning itself and deciding how big it's: x, y, width, and height.
function convertRectangles(x, y, width, height) {
    var x = parseFloat(x, 10);
    var y = parseFloat(y, 10);
    var width = parseFloat(width, 10);
    var height = parseFloat(height, 10);

    if (x < 0 || y < 0 || width < 0 || height < 0) {
        return '';
    }

    return 'M' + x + ',' + y + 'L' + (x + width) + ',' + y + ' ' + (x + width) + ',' + (y + height) + ' ' + x + ',' + (y + height) + 'z';
}
So far I have already shown you how to convert all shape elements into paths. With them, you're of course able to draw them all with the way provided above.
2. Drawing non-SVG pictures a.k.a images
Except for SVG files, we also expect drawing pictures with formats like PNG, JPG, or GIF. Only composed of pixel data, we cannot directly make use of it. Because of this reason, I have tried to use a normal technology in the region of Computer Vision, and that's Canny Edge Detection. With such detection, we can easily find contours of a bitmap image.
The whole process of finding contours can be simply described as: Gray Scale -> Gaussian Blur -> Canny Gradient -> Canny Non-maximum Suppression -> Canny Hysteresis -> Scanning. As we all know, this is also the process of Canny Edge Detection.
Before the process, we're going to define some common functions for use. The first item is rumImg function, which is mainly used for loading images from a Canvas, and converting all them into a matrix, composed with an array.
/**
 * [runImg: loading images from a Canvas object]
 * @param  {[type]}   canvas [the canvas object]
 * @param  {[type]}   size   [the size of the matrix, like 3 for 3x3 matrixs]
 * @param  {Function} fn     [callback function]
 */
function runImg(canvas, size, fn) {
    for (var y = 0; y < canvas.height; y++) {
        for (var x = 0; x < canvas.width; x++) {
            var i = x * 4 + y * canvas.width * 4;
            var matrix = getMatrix(x, y, size);
            fn(i, matrix);
        }
    }

    /**
     * [getMatrix: generate a matrix with a given size]
     * @param  {[type]} cx   [the x value of the central point]
     * @param  {[type]} cy   [the y value of the central point]
     * @param  {[type]} size [the size of the matrix you want to generate]
     * @return {[type]}      [return null if size is null, or return a matrix with a legal given size]
     */
    function getMatrix(cx, cy, size) {
        /**
         * will generate a 2d array of size x size given center x,
         * center y, size, image width & height
         */
        if (!size) {
            return;
        }

        var matrix = [];

        for (var i = 0, y = -(size - 1) / 2; i < size; i++, y++) {
            matrix[i] = [];

            for (var j = 0, x = -(size - 1) / 2; j < size; j++, x++) {
                matrix[i][j] = (cx + x) * 4 + (cy + y) * canvas.width * 4;
            }
        }

        return matrix;
    }
}
Then, we will also have some operations about imgData, a variable which comes from a prototype method of Context objects in a Canvas, Context.prototype.getImageData(x, y, width, height).
/**
 * [getRGBA: get the RGBA value of a given start point]
 * @param  {[type]} start   [the point you want to know]
 * @param  {[type]} imgData [image data of the canvas]
 * @return {[Object]}       [return an object composed with r, g, b, and a attributes respectively]
 */
function getRGBA(start, imgData) {
    return {
        r: imgData.data[start],
        g: imgData.data[start + 1],
        b: imgData.data[start + 2],
        a: imgData.data[start + 3]
    };
}

/**
 * [getPixel: same as getRGBA, but with legality checking]
 * @param  {[type]} i       [the point you want to know]
 * @param  {[type]} imgData [image data of the canvas]
 * @return {[Object]}       [return an object composed with r, g, b, and a attributes respectively]
 */
function getPixel(i, imgData) {
    if (i < 0 || i > imgData.data.length - 4) {
        return {
            r: 255,
            g: 255,
            b: 255,
            a: 255
        };
    } else {
        return getRGBA(i, imgData);
    }
}

/**
 * [setPixel: opposed to getPixel, this function is used to set value for specific points]
 * @param {[type]} i       [the point you want to set]
 * @param {[type]} val     [an object composed with r, g, b, and a attributes respectively]
 * @param {[type]} imgData [image data of the canvas]
 */
function setPixel(i, val, imgData) {
    imgData.data[i] = typeof val === 'number' ? val : val.r;
    imgData.data[i + 1] = typeof val === 'number' ? val : val.g;
    imgData.data[i + 2] = typeof val === 'number' ? val : val.b;
}
2.1 Gray Scale
Now, we are on the journey of finding contours, and all examples given by Codepen can be run by clicking Run buttons. Due to its complexity, you have to wait a moment before results are displayed on the screen.
Gray Scale in Wikipedia is defined as followed:
In photography and computing, a grayscale or greyscale digital image is an image in which the value of each pixel is a single sample, that is, it carries only intensity information."
In this section, we will use two methods to implement the process of greyscale:
/**
 * [calculateGray: calculate the gray value]
 * @param  {[type]} pixel [an object composed with r, g, b, and a attributes respectively]
 * @return {[Number]}     [return a grayscale value]
 */
function calculateGray(pixel) {
    return ((0.3 * pixel.r) + (0.59 * pixel.g) + (0.11 * pixel.b));
}

/**
 * [grayscale: process gray scale for the canvas]
 * @param  {[type]} canvas [the canvas object]
 */
function grayscale(canvas) {
    var ctx = canvas.getContext('2d');

    var imgDataCopy = ctx.getImageData(0, 0, canvas.width, canvas.height);
    var grayLevel;

    runImg(canvas, null, function (current) {
        grayLevel = calculateGray(getPixel(current, imgDataCopy));
        setPixel(current, grayLevel, imgDataCopy);
    });

    ctx.putImageData(imgDataCopy, 0, 0);
}
An example has been shown as followed:
See the Pen gLOgLM by aleen42 (@aleen42) on CodePen.
2.2 Gaussian Blur
Gaussian Blur is a way used to increase the accuracy of contours finding, and it's also known as the first step of a Canny Edge Detector.
/**
 * [sumArr: process sum of an given array]
 * @param  {[type]} arr [the array]
 * @return {[type]}     [return the sum value]
 */
function sumArr(arr) {
    var result = 0;

    arr.map(function(element, index) {
        result += (/^\s*function Array/.test(String(element.constructor))) ? sumArr(element) : element;
    });

    return result;
}

/**
 * [generateKernel: generate the kernel parameter of a Gaussian Blur algorithm]
 * @param  {[type]} sigma [the sigma value]
 * @param  {[type]} size  [the size of the matrix]
 * @return {[type]}       [description]
 */
function generateKernel(sigma, size) {
    var kernel = [];

    /** Euler's number rounded of to 3 places */
    var E = 2.718;

    for (var y = -(size - 1) / 2, i = 0; i < size; y++, i++) {
        kernel[i] = [];

        for (var x = -(size - 1) / 2, j = 0; j < size; x++, j++) {
            /** create kernel round to 3 decimal places */
            kernel[i][j] = 1 / (2 * Math.PI * Math.pow(sigma, 2)) * Math.pow(E, -(Math.pow(Math.abs(x), 2) + Math.pow(Math.abs(y), 2)) / (2 * Math.pow(sigma, 2)));
        }
    }

    /** normalize the kernel to make its sum 1 */
    var normalize = 1 / sumArr(kernel);

    for (var k = 0; k < kernel.length; k++) {
        for (var l = 0; l < kernel[k].length; l++) {
            kernel[k][l] = Math.round(normalize * kernel[k][l] * 1000) / 1000;
        }
    }

    return kernel;
}

/**
 * [gaussianBlur: run Gaussian Blur on a canvas object]
 * @param  {[type]} canvas [the canvas object]
 * @param  {[type]} sigma  [the sigma value]
 * @param  {[type]} size   [the size of the matrix]
 * @return {[type]}        [description]
 */
function gaussianBlur(canvas, sigma, size) {
    var ctx = canvas.getContext('2d');

    var imgDataCopy = ctx.getImageData(0, 0, canvas.width, canvas.height);
    var kernel = generateKernel(sigma, size);

    runImg(canvas, size, function (current, neighbors) {
        var resultR = 0;
        var resultG = 0;
        var resultB = 0;
        var pixel;

        for (var i = 0; i < size; i++) {
            for (var j = 0; j < size; j++) {
                pixel = getPixel(neighbors[i][j], imgDataCopy);

                /** return the existing pixel value multiplied by the kernel */
                resultR += pixel.r * kernel[i][j];
                resultG += pixel.g * kernel[i][j];
                resultB += pixel.b * kernel[i][j];
            }
        }

        setPixel(current, {
            r: resultR,
            g: resultG,
            b: resultB
        }, imgDataCopy);
    });

    ctx.putImageData(imgDataCopy, 0, 0);
}
If you want to check the effect, you can change the sigma and size parameters to rerun the followed demo.
See the Pen LbYWYN by aleen42 (@aleen42) on CodePen.
2.3 Canny Gradient
In this step, we are going to find the intensity gradient (G) of the image. Before that, we have to use the value for the first derivative in the horizontal direction (Gx) and the vertical direction (Gy), returned by an edge detector (Roberts, Prewitt, Sobel, etc.). Sobel Detector is exactly what we used.
Before processing gradient, we should export a module, used for operating pixels easily, which is named as Pixel.
(function(exports) {
    /** actually, there should be eight directions for each pixel */
    var DIRECTIONS = ['n', 'e', 's', 'w', 'ne', 'nw', 'se', 'sw'];

    function Pixel(i, w, h, canvas) {
        this.index = i;
        this.width = w;
        this.height = h;
        this.neighbors = [];
        this.canvas = canvas;

        DIRECTIONS.map(function(d, idx) {
            this.neighbors.push(this[d]());
        }.bind(this));
    }

    /**
     * This object was created to simplify getting the
     * coordinates of any of the 8 neighbouring pixels
     * _______________
     * | NW | N | NE |
     * |____|___|____|
     * | W  | C | E  |
     * |____|___|____|
     * | SW | S | SE |
     * |____|___|____|
     * given the index, width and height of matrix
    **/

    Pixel.prototype.n = function() {
        /**
         * pixels are simply arrays in canvas image data
         * where 1 pixel occupies 4 consecutive elements
         * equal to r-g-b-a
         */
        return (this.index - this.width * 4);
    };

    Pixel.prototype.e = function() {
        return (this.index + 4);
    };

    Pixel.prototype.s = function() {
        return (this.index + this.width * 4);
    };

    Pixel.prototype.w = function() {
        return (this.index - 4);
    };

    Pixel.prototype.ne = function() {
        return (this.index - this.width * 4 + 4);
    };

    Pixel.prototype.nw = function() {
        return (this.index - this.width * 4 - 4);
    };

    Pixel.prototype.se = function() {
        return (this.index + this.width * 4 + 4);
    };

    Pixel.prototype.sw = function() {
        return (this.index + this.width * 4 - 4);
    };

    Pixel.prototype.r = function() {
        return this.canvas[this.index];
    };

    Pixel.prototype.g = function() {
        return this.canvas[this.index + 1];
    };;

    Pixel.prototype.b = function() {
        return this.canvas[this.index + 2];
    };

    Pixel.prototype.a = function() {
        return this.canvas[this.index + 3];
    };

    Pixel.prototype.isBorder = function() {
        return (this.index - (this.width * 4)) < 0 ||
            (this.index % (this.width * 4)) === 0 ||
            (this.index % (this.width * 4)) === ((this.width * 4) - 4) ||
            (this.index + (this.width * 4)) > (this.width * this.height * 4);
    };

    exports.Pixel = Pixel;
}(this));
With the Pixel, we can just start to implement the process of Gradient:
function roundDir(deg) {
    /** rounds degrees to 4 possible orientations: horizontal, vertical, and 2 diagonals */
    var deg = deg < 0 ? deg + 180 : deg;

    if ((deg >= 0 && deg <= 22.5) || (deg > 157.5 && deg <= 180)) {
        return 0;
    } else if (deg > 22.5 && deg <= 67.5) {
        return 45;
    } else if (deg > 67.5 && deg <= 112.5) {
        return 90;
    } else if (deg > 112.5 && deg <= 157.5) {
        return 135;
    }
};

function gradient(canvas, op) {
    var ctx = canvas.getContext('2d');

    var imgData = ctx.getImageData(0, 0, canvas.width, canvas.height);
    var imgDataCopy = ctx.getImageData(0, 0, canvas.width, canvas.height);

    var dirMap = [];
    var gradMap = [];

    var SOBEL_X_FILTER = [
        [-1, 0, 1],
        [-2, 0, 2],
        [-1, 0, 1]
    ];

    var SOBEL_Y_FILTER = [
        [1, 2, 1],
        [0, 0, 0],
        [-1, -2, -1]
    ];

    var ROBERTS_X_FILTER = [
        [1, 0],
        [0, -1]
    ];

    var ROBERTS_Y_FILTER = [
        [0, 1],
        [-1, 0]
    ];

    var PREWITT_X_FILTER = [
        [-1, 0, 1],
        [-1, 0, 1],
        [-1, 0, 1]
    ];

    var PREWITT_Y_FILTER = [
        [-1, -1, -1],
        [0, 0, 0],
        [1, 1, 1]
    ];

    var OPERATORS = {
        'sobel': {
            x: SOBEL_X_FILTER,
            y: SOBEL_Y_FILTER,
            len: SOBEL_X_FILTER.length
        },
        'roberts': {
            x: ROBERTS_X_FILTER,
            y: ROBERTS_Y_FILTER,
            len: ROBERTS_Y_FILTER.length
        },
        'prewitt': {
            x: PREWITT_X_FILTER,
            y: PREWITT_Y_FILTER,
            len: PREWITT_Y_FILTER.length
        }
    };

    runImg(canvas, 3, function (current, neighbors) {
        var edgeX = 0;
        var edgeY = 0;
        var pixel = new Pixel(current, imgDataCopy.width, imgDataCopy.height);

        if (!pixel.isBorder()) {
            for (var i = 0; i < OPERATORS[op].len; i++) {
                for (var j = 0; j < OPERATORS[op].len; j++) {
                    edgeX += imgData.data[neighbors[i][j]] * OPERATORS[op]["x"][i][j];
                    edgeY += imgData.data[neighbors[i][j]] * OPERATORS[op]["y"][i][j];
                }
            }
        }

        dirMap[current] = roundDir(Math.atan2(edgeY, edgeX) * (180 / Math.PI));
        gradMap[current] = Math.round(Math.sqrt(edgeX * edgeX + edgeY * edgeY));

        setPixel(current, gradMap[current], imgDataCopy);
    });

    ctx.putImageData(imgDataCopy, 0, 0);
}
And the demo should look like this:
See the Pen aBbpWM by aleen42 (@aleen42) on CodePen.
2.4 Canny Non-maximum Suppression
Non-Maximum suppression is applied to "thin" the edge. As you can see, after applying the gradient calculation, the edge extracted from the gradient value is still quite blurred. With respect to criterion 3, there should only be one accurate response to the edge. Thus non-maximum suppression can help to suppress all the gradient values to 0 except the local maximal, which indicates a location with the sharpest change of intensity value.
With the calculated dirMap and gradMap provided by the last step:
function getPixelNeighbors(dir) {
    var degrees = {
        0: [{ x: 1, y: 2 }, { x: 1, y: 0 }],
        45: [{ x: 0, y: 2 }, { x: 2, y: 0 }],
        90: [{ x: 0, y: 1 }, { x: 2, y: 1 }],
        135: [{ x: 0, y: 0 }, { x: 2, y: 2 }]
    };

    return degrees[dir];
}

function nonMaximumSuppress(canvas, dirMap, gradMap) {
    var ctx = canvas.getContext('2d');

    var imgDataCopy = ctx.getImageData(0, 0, canvas.width, canvas.height);

    runImg(canvas, 3, function(current, neighbors) {
        var pixNeighbors = getPixelNeighbors(dirMap[current]);

        /** pixel neighbors to compare */
        var pix1 = gradMap[neighbors[pixNeighbors[0].x][pixNeighbors[0].y]];
        var pix2 = gradMap[neighbors[pixNeighbors[1].x][pixNeighbors[1].y]];

        if (pix1 > gradMap[current] ||
            pix2 > gradMap[current] ||
            (pix2 === gradMap[current] &&
                pix1 < gradMap[current])) {
            setPixel(current, 0, imgDataCopy);
        }
    });

    ctx.putImageData(imgDataCopy, 0, 0);
}
After suppression, it seems greater than before:
See the Pen jVOBNe by aleen42 (@aleen42) on CodePen.
2.5 Canny Hysteresis
However, there're also so-called "weak" edges needed to be processed. Canny Hysteresis is an improved solution for Canny Edge Detection.
function createHistogram(canvas) {
    var histogram = {
        g: []
    };

    var size = 256;
    var total = 0;

    var ctx = canvas.getContext('2d');

    var imgData = ctx.getImageData(0, 0, canvas.width, canvas.height);

    while (size--) {
        histogram.g[size] = 0;
    }

    runImg(canvas, null, function(i) {
        histogram.g[imgData.data[i]]++;
        total++;
    });

    histogram.length = total;

    return histogram;
};

function calcBetweenClassVariance(weight1, mean1, weight2, mean2) {
    return weight1 * weight2 * (mean1 - mean2) * (mean1 - mean2);
};

function calcWeight(histogram, s, e) {
    var total = histogram.reduce(function(i, j) {
        return i + j;
    }, 0);

    var partHist = (s === e) ? [histogram[s]] : histogram.slice(s, e);
    var part = partHist.reduce(function(i, j) {
        return i + j;
    }, 0);

    return parseFloat(part, 10) / total;
};

function calcMean(histogram, s, e) {
    var partHist = (s === e) ? [histogram[s]] : histogram.slice(s, e);

    var val = 0;
    var total = 0;

    partHist.forEach(function(el, i) {
        val += ((s + i) * el);
        total += el;
    });

    return parseFloat(val, 10) / total;
};

function fastOtsu(canvas) {
    var histogram = createHistogram(canvas);
    var start = 0;
    var end = histogram.g.length - 1;

    var leftWeight;
    var rightWeight;
    var leftMean;
    var rightMean;

    var betweenClassVariances = [];
    var max = -Infinity;
    var threshold;

    histogram.g.forEach(function(el, i) {
        leftWeight = calcWeight(histogram.g, start, i);
        rightWeight = calcWeight(histogram.g, i, end + 1);
        leftMean = calcMean(histogram.g, start, i);
        rightMean = calcMean(histogram.g, i, end + 1);
        betweenClassVariances[i] = calcBetweenClassVariance(leftWeight, leftMean, rightWeight, rightMean);

        if (betweenClassVariances[i] > max) {
            max = betweenClassVariances[i];
            threshold = i;
        }
    });

    return threshold;
};

function getEdgeNeighbors(i, imgData, threshold, includedEdges) {
    var neighbors = [];
    var pixel = new Pixel(i, imgData.width, imgData.height);

    for (var j = 0; j < pixel.neighbors.length; j++) {
        if (imgData.data[pixel.neighbors[j]] >= threshold && (includedEdges === undefined || includedEdges.indexOf(pixel.neighbors[j]) === -1)) {
            neighbors.push(pixel.neighbors[j]);
        }
    }

    return neighbours;
}

function _traverseEdge(current, imgData, threshold, traversed) {
    /**
     * traverses the current pixel until a length has been reached
     * initialize the group from the current pixel's perspective
     */
    var group = [current];

    /** pass the traversed group to the getEdgeNeighbors so that it will not include those anymore */
    var neighbors = getEdgeNeighbors(current, imgData, threshold, traversed);

    for (var i = 0; i < neighbors.length; i++) {
        /** recursively get the other edges connected */
        group = group.concat(_traverseEdge(neighbors[i], imgData, threshold, traversed.concat(group)));
    }

    /** if the pixel group is not above max length, it will return the pixels included in that small pixel group */
    return group;
}

function hysteresis(canvas) {
    var ctx = canvas.getContext('2d');

    var imgDataCopy = ctx.getImageData(0, 0, canvas.width, canvas.height);

    /** where real edges will be stored with the 1st pass */
    var realEdges = [];

    /** high threshold value */
    var t1 = fastOtsu(canvas);

    /** low threshold value */
    var t2 = t1 / 2;

    /** first pass */
    runImg(canvas, null, function(current) {
        if (imgDataCopy.data[current] > t1 && realEdges[current] === undefined) {
            /** accept as a definite edge */
            var group = _traverseEdge(current, imgDataCopy, t2, []);
            for (var i = 0; i < group.length; i++) {
                realEdges[group[i]] = true;
            }
        }
    });

    /** second pass */
    runImg(canvas, null, function(current) {
        if (realEdges[current] === undefined) {
            setPixel(current, 0, imgDataCopy);
        } else {
            setPixel(current, 255, imgDataCopy);
        }
    });

    ctx.putImageData(imgDataCopy, 0, 0);
}
Or what will it be after removing weak edges from strong ones?
See the Pen RowpLx by aleen42 (@aleen42) on CodePen.
Wow, it looks perfect for me.
2.6 Scanning
With the image, which only has two kinds of pixels: 0 and 255, we can just scan each of them to generate a path with points. The algorithm can be described as followed:
- Loop for getting pixels, and check whether it's marked as seen and its value is 255.
- When it matches, find out a direction to generate a path as longest as possible. (Each pixel will be marked as seen when a path is made of itself, while a path is a true path when its points have been more than a value, 6 ~ 10.)
After scanning, we will extract data of paths like SVGs have, and of course, you can draw it as well.
3. Summary
The article has talked about how to draw in JavaScript in details, no matter SVG files or any images of PNG, JPG, or GIF. The core idea to implement such requirements is to convert them all into data of paths with a specific format. As long as we can extract out such data, of course, we can also simulate to draw pictures in JavaScript.
- For
pathelements in SVG files, just draw it directly. - When it comes to other elements like
rect, we can convert them before. - Using Canny Edge Detection to detect contours in any bitmap images, so that we can draw them.
4. Reference
- "Animated Glowing Line Drawing", 2016
- "Finding Contours of a bitmap image", 2016
- "Drawing an SVG file", 2016
- "Calibration parameters for drawing an SVG file", 2016
- "Convert all shapes/primitives into path elements of SVG", 2016
- "contour", 2015
- "Canny edge detector", Wikipedia, 2016
As the plugin is integrated with a code management system like GitLab or GitHub, you may have to auth with your account before leaving comments around this article.
Notice: This plugin has used Cookie to store your token with an expiration.